
Some links in this post may be affiliate links. I may earn a commission at no extra cost to you.
Table of Contents
When I first launched Nomad Den, I was publishing posts, building out a network of pages, and adding affiliate links. Through that, I genuinely had no idea if any of it was working. I did know that traffic was little to nothing, and would be for a while, and I had no system for knowing whether a post was getting found, whether anyone was clicking my links, or whether the visitors landing on my site were staying long enough to read anything at all.
This is what happens when you skip analytics. I recommend installing and understanding analytics because I learned the hard way. It’s kind of my modus operandi. Turns out, that’s a pretty common starting point.
Most beginners either ignore data entirely, because it feels overwhelming, or they open up a dashboard, stare at a wall of numbers they don’t understand, and close the tab. Neither approach helps your business grow.
What Are Digital Marketing Analytics?
Digital marketing analytics is how you stop guessing and start making decisions based on what’s actually happening. It applies whether you’re running a blog, an affiliate site, an ecommerce store, or a local business with an online presence. The data doesn’t care about your business model — it just tells you the truth.
In this guide, I’ll break down what analytics actually means for beginners, why it matters from day one, what you should be tracking across your different channels, and which tools to use, including the ones already built into the platforms you’re probably using right now.
You don’t need to become a data analyst. You just need to know your numbers well enough to make smarter moves.
What Are Analytics, Metrics, and KPIs? (And Why It Matters Which Is Which)
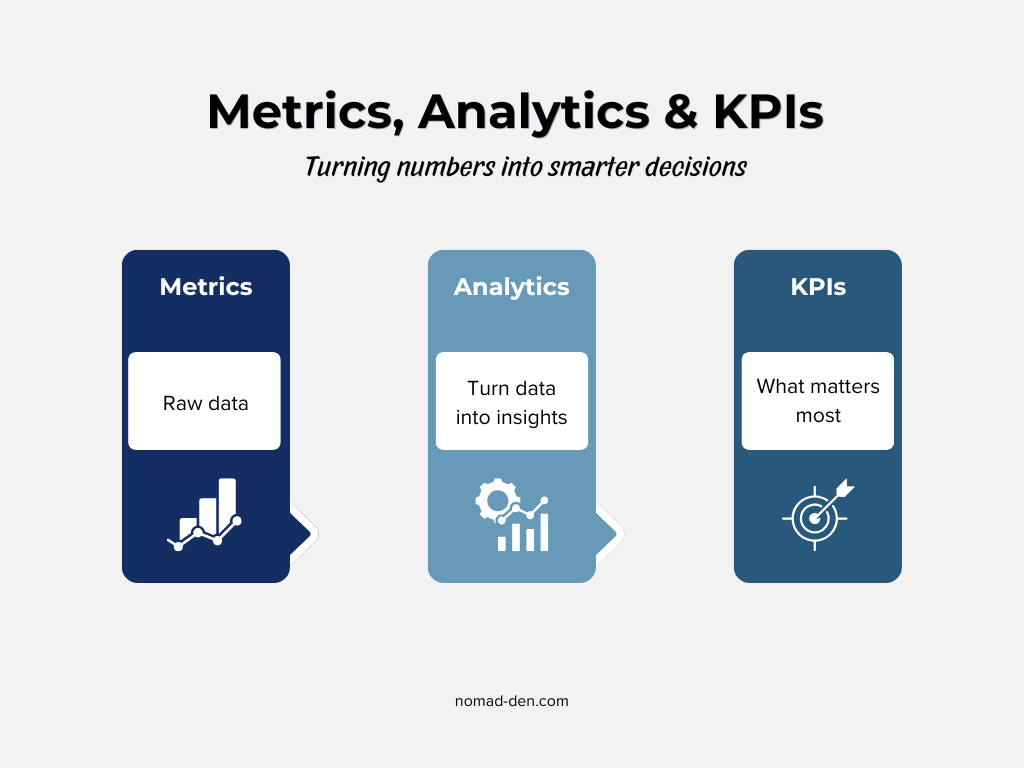
Before diving in, it helps to get these three terms straight. They get used interchangeably all the time, but they mean different things.
Metrics are the raw numbers your tools collect, like page views, email opens, link clicks, and bounce rate. Just data points sitting in a dashboard.
Analytics is what happens when you actually look at those numbers and try to understand them. It’s the process of turning raw data into something useful. Metrics tell you what happened. Analytics helps you understand why.
KPIs (Key Performance Indicators) are the specific metrics that matter most to your goals right now. Not every number deserves your attention. A KPI is the one you’ve decided to measure because it tells you whether your business is moving in the right direction.
Here’s the simplest way to remember it: all KPIs are metrics, but not all metrics are KPIs. To understand more terms about online business, check out our Glossary.
For example, your total page views are a metric. But if your current goal is to grow your email list, page views probably aren’t a KPI. Your opt-in rate is. Same data ecosystem, different priorities.
What Should Beginners Actually Track?
First of all, you don’t need to track everything. Trying to monitor every available metric at once is one of the fastest ways to get overwhelmed and do nothing. Start with what’s relevant to where you are right now, and build from there.
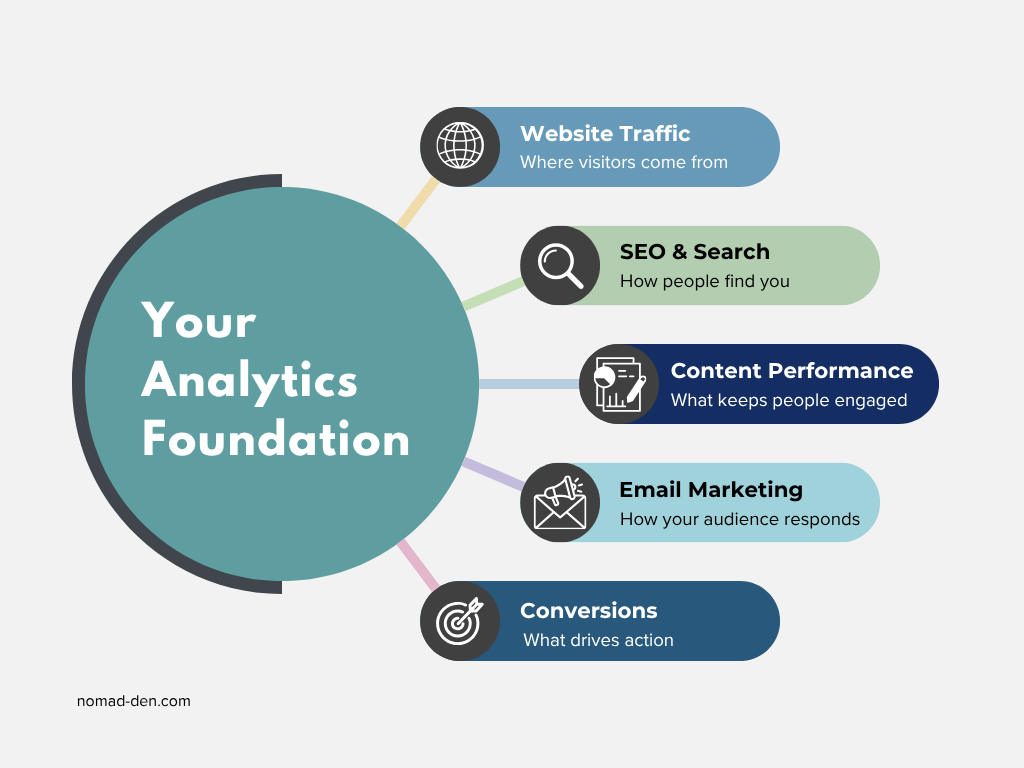
Below is a breakdown by channel, starting with the foundation:
Website Traffic Metrics
Your website is the hub. Everything else feeds back to it, so understanding what’s happening here is where analytics starts.
Total visits is your baseline pulse check. On its own it doesn’t tell you much, but you want to see it trending upward over months.
Traffic sources show you where visitors are coming from: organic search, direct, social, referral, or email. This is more valuable than total visits because it tells you which channels are actually working.
New vs. returning visitors reflects both discovery and loyalty. New visitors mean your content is being found. Returning visitors mean people came back for more.
Bounce rate measures the percentage of visitors who leave without taking any action. High bounce rate on a post that’s supposed to lead somewhere else is worth investigating.
Average session duration tells you how long people are spending on your site. Short sessions on long-form content are a red flag.
Top landing pages are your most important pages from a first impression standpoint, and usually your strongest SEO performers. Keep them updated.
SEO and Search Metrics
Search metrics tell you what’s happening before that, inside search engines themselves. Google Search Console covers Google, which still accounts for the majority of search traffic, but the principle applies across any search platform you’re targeting. You need both layers to see the full picture.
Impressions are how many times your pages appeared in search results. High impressions with low clicks usually means your title or meta description isn’t earning the click.
Clicks are how many of those impressions turned into actual visits. This is the number that connects search visibility to real traffic.
Click-through rate (CTR) is clicks divided by impressions. If your CTR is consistently low, your headlines and meta descriptions are worth revisiting.
Average position tells you where your pages rank for the queries they appear in. Positions 1 through 3 capture the majority of clicks. Beyond page one is mostly invisible.
Organic traffic growth reflects the big picture: month over month, is your search traffic growing? It’s a slow burn on a newer site, but one of the most meaningful indicators that your content strategy is working.
Content Performance Metrics
Not all posts perform equally. Content metrics help you figure out which posts are driving results so you can do more of what’s working.
Engagement rate tracks the percentage of sessions where someone was actively engaged: they stayed more than 10 seconds, viewed more than one page, or completed an action. It’s a more honest picture of whether your content is landing than bounce rate alone.
Time on page is a proxy for whether people are actually reading. Context matters here. A 90-second average on a 4,000-word pillar post is a problem worth addressing.
Top performing posts are your best assets. They’re already earning traffic, which means they deserve regular updates, strong internal links, and attention to what’s making them work.
High traffic, low conversion pages are the gap signal. These pages are getting found but not converting anyone into an email subscriber or an affiliate click. The traffic is already there. The fix is usually a clearer call to action or a better content-to-offer match.
Email Marketing Metrics
Once you have a list, even a small one, you have a direct line to your audience that no algorithm can take away. These are the numbers that tell you whether people are actually engaging with what you send.
Open rate measures the percentage of subscribers who opened a given email. Worth noting: since Apple introduced Mail Privacy Protection in 2021, open rates have been inflated for lists with Apple Mail users, because Apple pre-loads email content and registers it as an open automatically. Use it as a directional metric, not a hard truth.
Click rate is more reliable. It measures the percentage of subscribers who clicked a link inside your email. This requires a real action, which makes it a genuine engagement signal.
Unsubscribe rate tells you how your audience is responding. Some unsubscribes are normal. A spike after a specific campaign is feedback worth paying attention to.
Subscriber growth is the long game. Is your list getting bigger over time? Flat or declining growth means something in your opt-in pipeline needs attention.
Sequence engagement matters once you have automated flows set up. In GetResponse, you can see open and click rates at each individual step of a sequence. If engagement drops sharply at a specific email, that’s a clear signal to fix that step.
GetResponse makes it easy to track exactly how your email sequences are performing. Try it free for 14 days.


Conversion Metrics
This is where analytics connects directly to revenue. Everything else is upstream. Conversions are the point.
Conversion rate is the percentage of visitors who complete a desired action. That action depends on your goal: an affiliate click, an email opt-in, or a purchase. The math is simple: conversions divided by total visitors, multiplied by 100.
Affiliate link clicks are the first step in the revenue chain for a site like this one. If a post is getting traffic but generating zero affiliate clicks, the offer may not match the audience, or the links aren’t visible enough. Both are fixable.
Opt-in rate measures what percentage of page visitors are signing up for your email list. A low opt-in rate usually points to one of three things: the wrong traffic, a weak offer, or a form that isn’t getting seen.
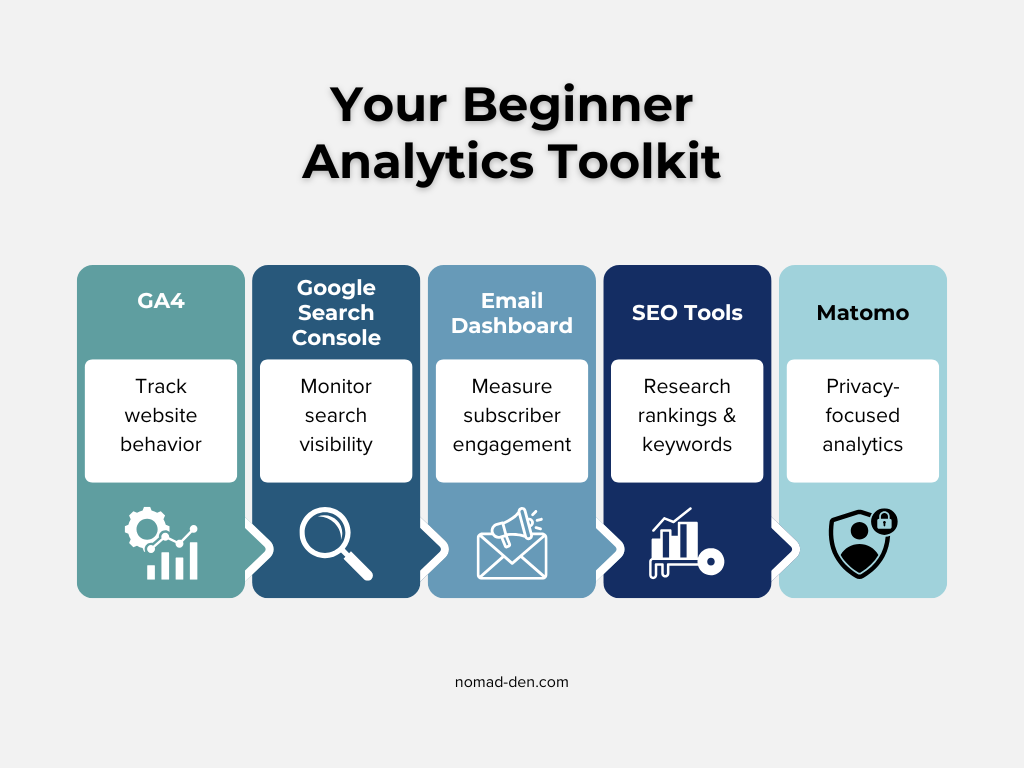
The Best Analytics Tools for Beginners
The good news: you don’t need to spend money to get started. There’s a solid free foundation that covers most of what a beginner actually needs, and you can build from there as your site and channels grow.
A quick note before the breakdown. More tools does not mean better data. Start with the free essentials, learn what they’re telling you, and only add something new when you have a specific question that your current tools can’t answer.
Google Analytics 4 (GA4)
GA4 is the industry standard for website analytics. It’s free, and it tracks visitor behavior after someone lands on your site: where they came from, what pages they visited, how long they stayed, and whether they completed any goals you’ve set up.
It has a learning curve. The interface isn’t the most beginner-friendly, but it’s worth learning because it integrates directly with Google Search Console, Google Ads, and most third-party marketing tools.
If you’re starting from zero, GA4 is the first thing to install.
Google Search Console (GSC)
Where GA4 tells you what happens on your site, Google Search Console tells you what’s happening in Google before anyone clicks. Impressions, clicks, CTR, average position, indexing status, and any technical issues Google has flagged on your pages.
It’s free, it’s non-negotiable for any site relying on organic search, and it pairs directly with GA4 to give you a complete picture from search result to on-site behavior.
Your Email Dashboard
Whichever email platform you’re using already has analytics built in. Open rate, click rate, unsubscribes, and subscriber growth are standard across most platforms. Check your dashboard after every broadcast. It takes two minutes and tells you more about your audience than almost any other single data point.
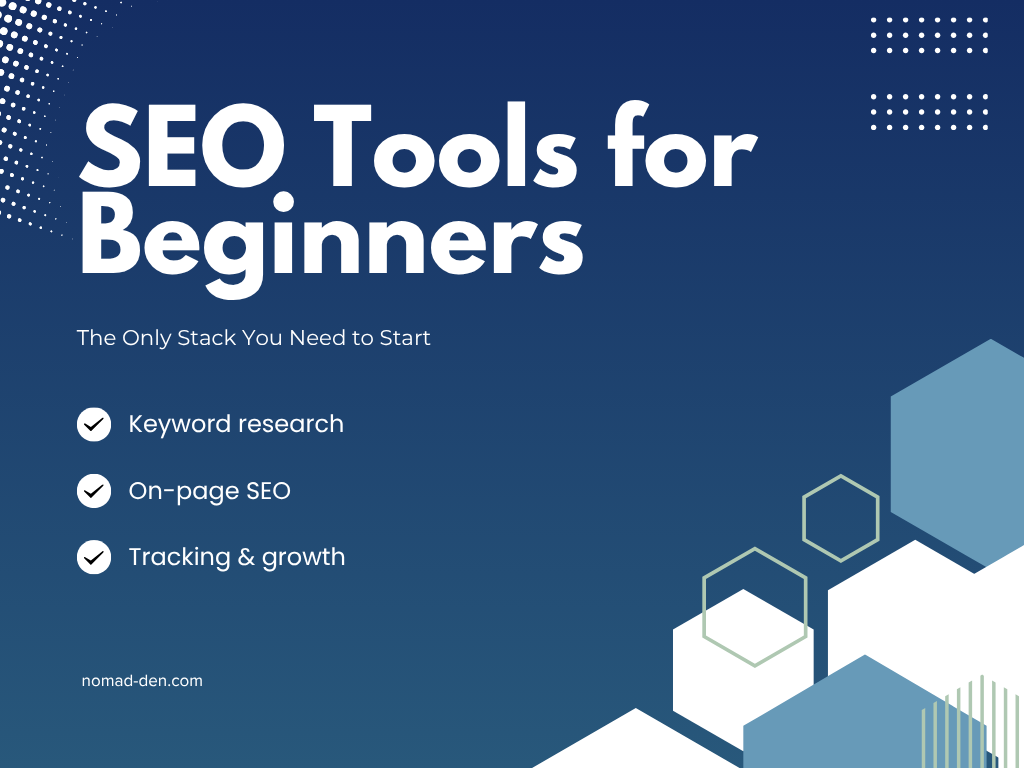
SEO Tools
Your SEO toolkit adds a research and ranking layer on top of what GSC provides. If you want a full breakdown of beginner-friendly options, my SEO Tools post covers the complete stack.
Privacy-First Alternative
If data ownership matters to you, Matomo is worth looking at. It’s open-source, cookieless by default, and your data stays yours. Full details on the Privacy-First Tools page.
The Analytics You’re Already Getting (And Probably Ignoring)
Here’s something most analytics guides skip entirely: you don’t have to set everything up from scratch. The platforms you’re already using are already collecting data. You just need to know where to look.
Affiliate networks like CJ and ClickBank already track clicks, conversions, and EPC (earnings per click) for every offer you’re promoting. That data is sitting there whether you check it or not. Checking it regularly tells you which content is actually driving revenue and which offers aren’t converting, so you can make smarter decisions about where to focus.
Systeme.io has funnel analytics built in. If you’re using it to run landing pages or opt-in sequences, you can see step-by-step conversion rates inside the platform.
Native platform dashboards on Pinterest Business and Meta Business Suite track impressions, reach, and engagement data without any third-party setup required.
The point isn’t that you need to monitor all of these simultaneously. It’s that the data exists before you spend a dollar on analytics tools. Start there.
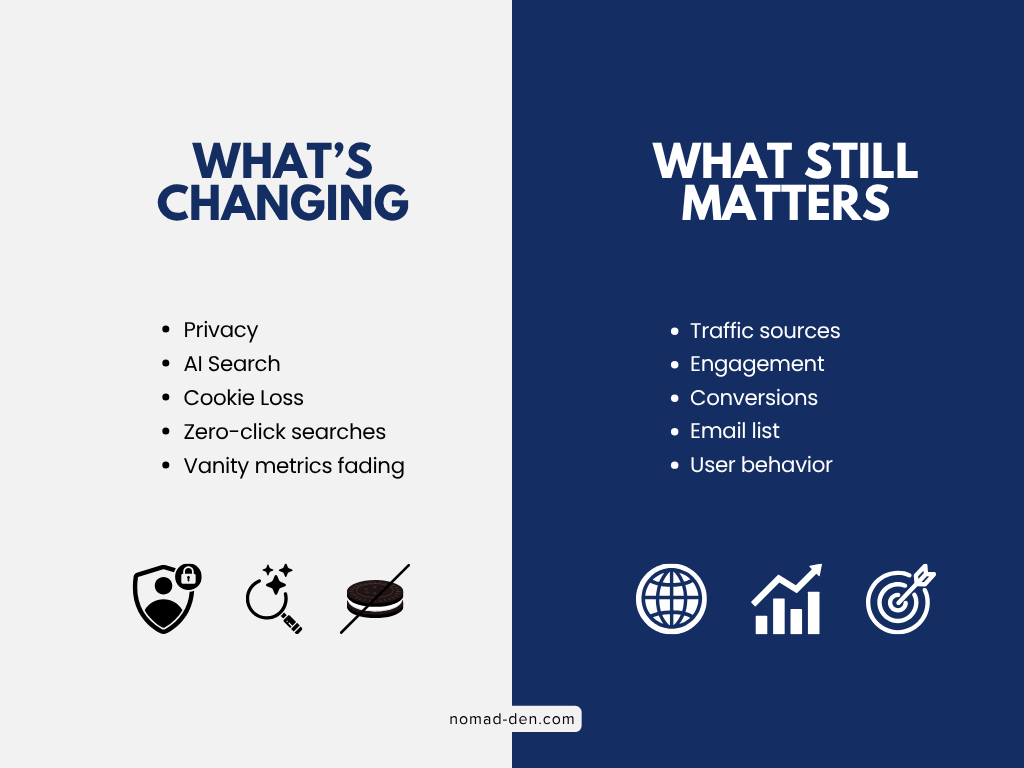
How Analytics Is Changing (And What Stays the Same)
Analytics as a practice isn’t static. A few shifts are worth knowing about, not because you need to act on all of them immediately, but because understanding the direction things are moving helps you build smarter from the start.
Privacy is reshaping how data gets collected. Third-party cookies are being phased out across browsers, which means some GA4 data is increasingly estimated rather than exact. It’s a reason to care about first-party data: your email list, your own analytics setup, and tools like Matomo that don’t rely on third-party cookies at all.
AI is changing search behavior. A growing percentage of searches now end without a click, because AI-generated summaries answer the question directly on the results page. This doesn’t make SEO irrelevant, but it does mean that raw traffic numbers may tell an incomplete story. Engagement metrics and conversions matter more than ever as a result.
Vanity metrics are losing their influence. Impressions, follower counts, and raw page views look good in a screenshot but don’t tell you whether your business is growing. The shift across the industry is toward metrics that connect directly to outcomes: conversion rate, email list growth, revenue per visitor. Build your tracking habits around those from the beginning and you won’t have to unlearn anything later.
What doesn’t change: the fundamentals. Know where your traffic comes from. Know what people do when they arrive. Know whether your content is converting. Those three questions have been at the center of digital marketing analytics since the beginning, and they’ll stay there regardless of what the tools look like.
Frequently Asked Questions
Final Thoughts
Analytics isn’t something you master overnight, and it doesn’t need to be. The goal at the beginner stage isn’t to understand every metric in every dashboard. It’s to build the habit of checking your numbers regularly and letting what you find inform what you do next.
Start with GA4 and Google Search Console. Learn what they’re telling you. Check your email platform dashboard after every broadcast. Look at your affiliate network reports to see what’s actually converting. That’s it. That’s the foundation.
As your site grows and you add more channels, your analytics stack grows with it. But the questions stay the same: where is my traffic coming from, what are people doing when they get here, and is my content converting? Answer those consistently and you’ll always know where to focus.
The data is already there. You just have to look at it.
Some links in this post may be affiliate links. I may earn a commission at no extra cost to you. Learn more here.
Continue Reading Related Posts

How to Validate a Business Idea Before Wasting Months Building It
When you come up with an idea for an online business, you’re anxious to make…

Lead Magnets That Convert in 2026 (And What to Build First)
Building an email list sounds straightforward until you actually try it. The real challenges aren’t…
SEO Tools for Beginners (Free + Paid): The Only Stack You Need (2026)
As long as people are searching for information online, SEO (search engine optimization) will remain…
17 SEO Terms Every Beginner Should Know
If you’re new to SEO, the most important terms to understand include keywords, search intent,…
Digital Marketing Guide: Where to Start and How It Works
Digital marketing is the promotion of products or services using digital channels such as search…

Content Creation vs Content Marketing: What’s the Difference?
Content creation is producing content. Content marketing is strategically using the content you produced to…